/ 01 of 05
Read 4 min ·
Skim 1 min
Trip planner that plans for the transfer
Riders missed 31% fewer connections in the 12 weeks after launch.
Role
Lead product designer
Team
1 PM, 6 engineers, 1 data analyst, 1 researcher (part-time)
Timeline
7 months, Jan to Jul 2026
Platform
Mobile, iOS and Android
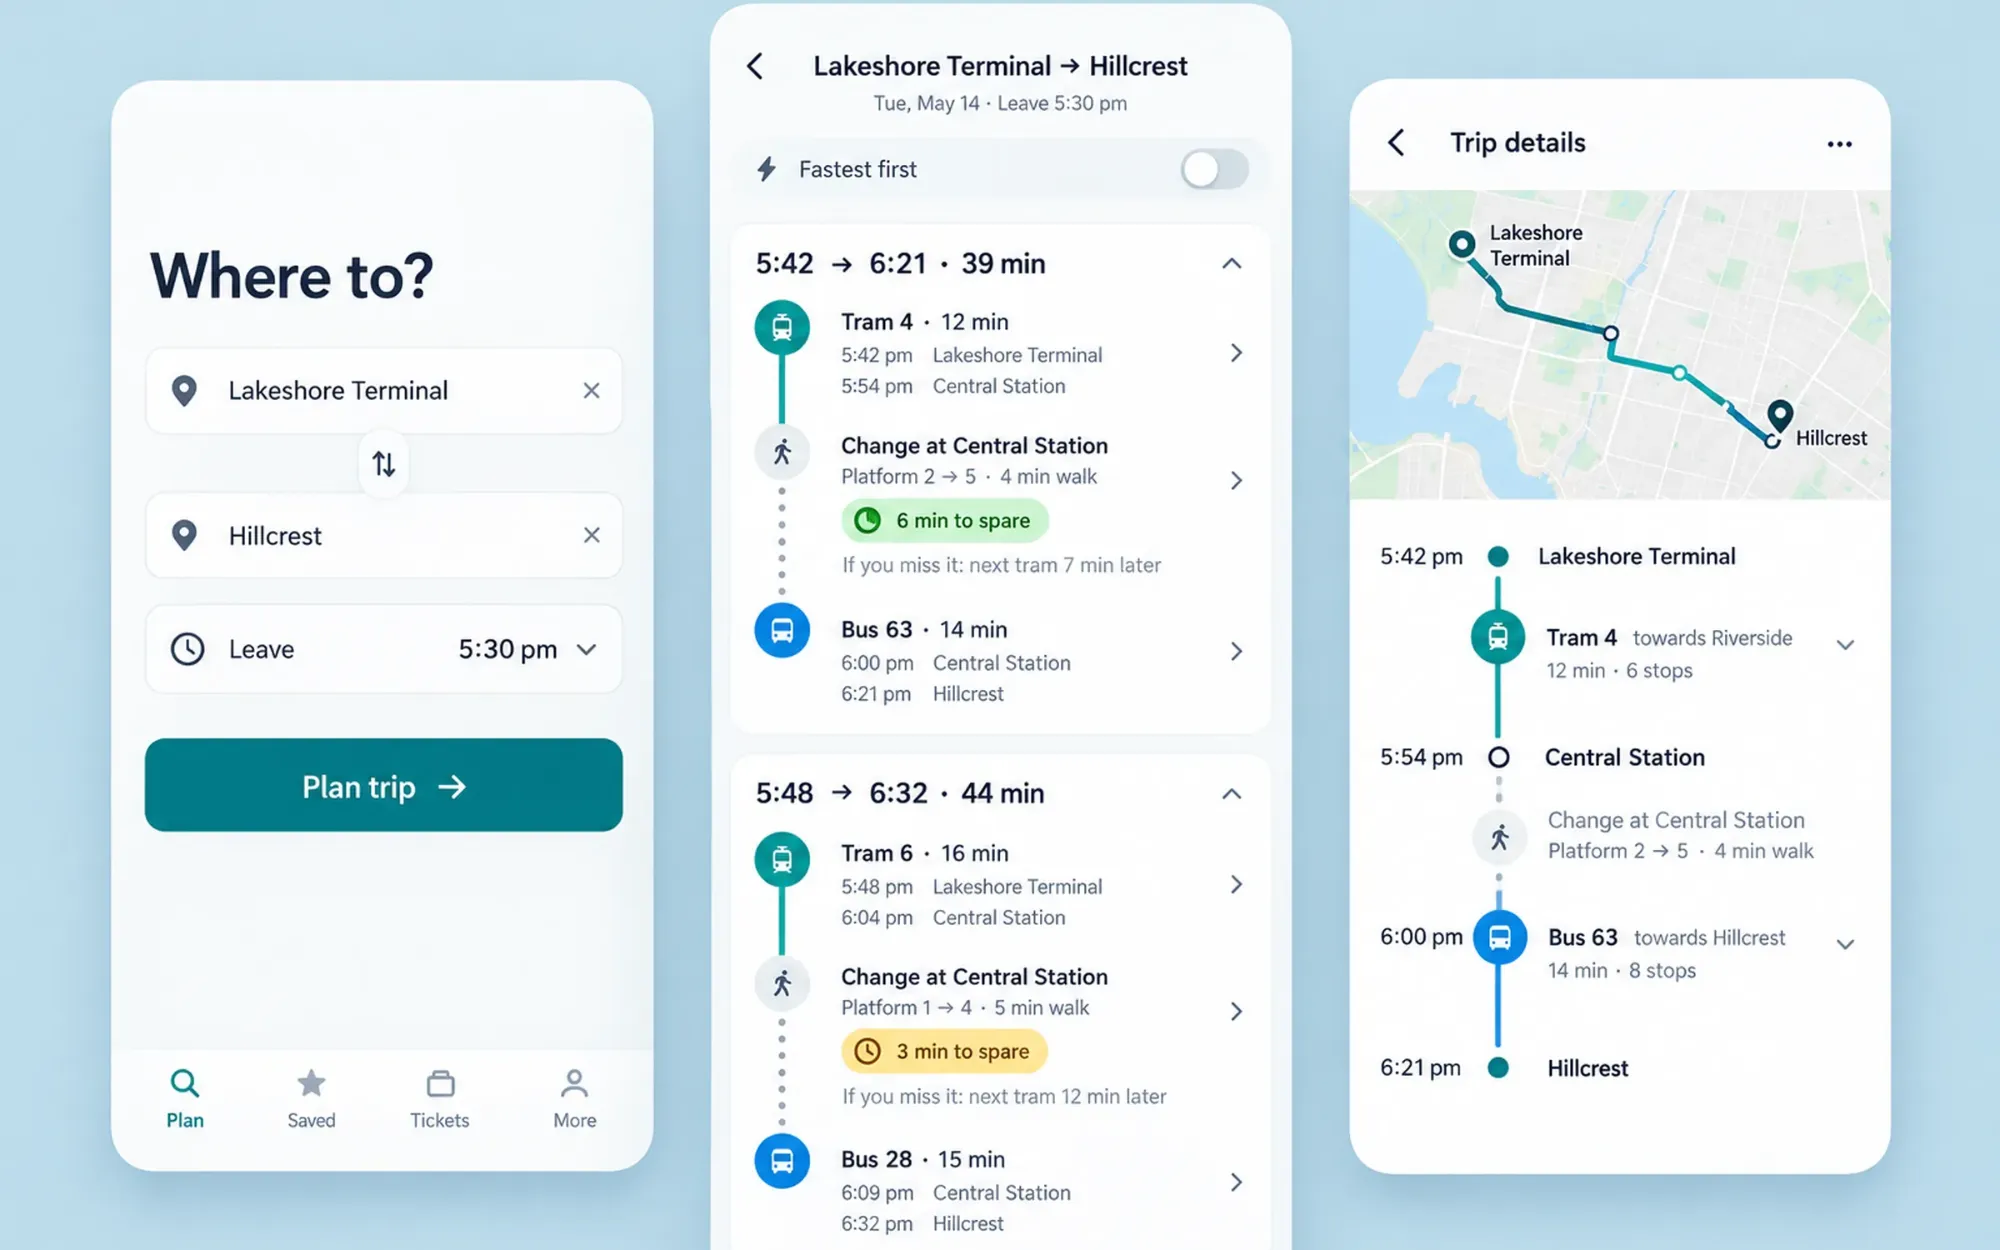
Skim mode: key sentences, key images and the outcome only. (4 min)
Context
Ligne is the trip-planning app for a city of 1.8 million. About 410,000 people open it every month to get between trams and buses. In 2026 I led a seven-month rebuild of its trip planner. I worked with a product manager, six engineers, a data analyst and a part-time researcher. The old planner asked one question, “what is the fastest way?”, and answered it well. For three years nearly every roadmap item had been about answering it a little faster.
Problem
One in seven trips that included a transfer ended in a missed connection. That figure came from the analyst’s first week: 2.1 million trips matched against vehicle positions. The planner was never wrong about the timetable. It was wrong about people. It offered three-minute transfers that only work if both vehicles run on time and you cross a busy plaza at a jog.
Riders had worked this out long before we had. They padded every plan by hand, switched to a map app for the second leg, or simply stopped believing the transfer step. The brief became a plan a rider can rely on, even if it costs minutes.
Research
For two weeks I stood at three transfer points, Central Station, Lakeshore Terminal and the Dufferin Loop, and rode with fourteen regular commuters on journeys they make every week. We recruited through the app and paid for their time.
I don’t need it quick. I need to know if I’ll make the 5:42 or stand there for twenty minutes.
Rider, 34, at Lakeshore Terminal
Riders think about whether they will make a transfer, and what happens if they don’t, not about minutes. A mother with a stroller described the walk at Central as “four minutes if the lift works, ten if it doesn’t”. The planner said one.
The data agreed. We measured real walking times from phone traces at the twelve busiest hubs. The planner undercounted walking by 2.5 minutes on average. Its flat 80 metres a minute ignored stairs, and Line 7, which feeds half the city’s transfers, ran late on 22% of weekday evenings.
Those numbers changed the room. The product manager had assumed the problem was lateness, which we could not fix. The data showed the larger share came from the walk, which we could.
Decisions
Rank by the chance of making it
We stopped sorting results by arrival time. The top result is the fastest route with five spare minutes; a “Fastest” toggle keeps the old order. Product was wary, because the median trip gets 1.4 minutes longer. We ran it as a six-week experiment so the argument could be about data instead of taste.
Engineering asked a fair question: how do you rank by something you cannot observe? We settled on a plain rule, the walking-time estimate plus the line’s 80th-percentile delay, and left anything cleverer for later.
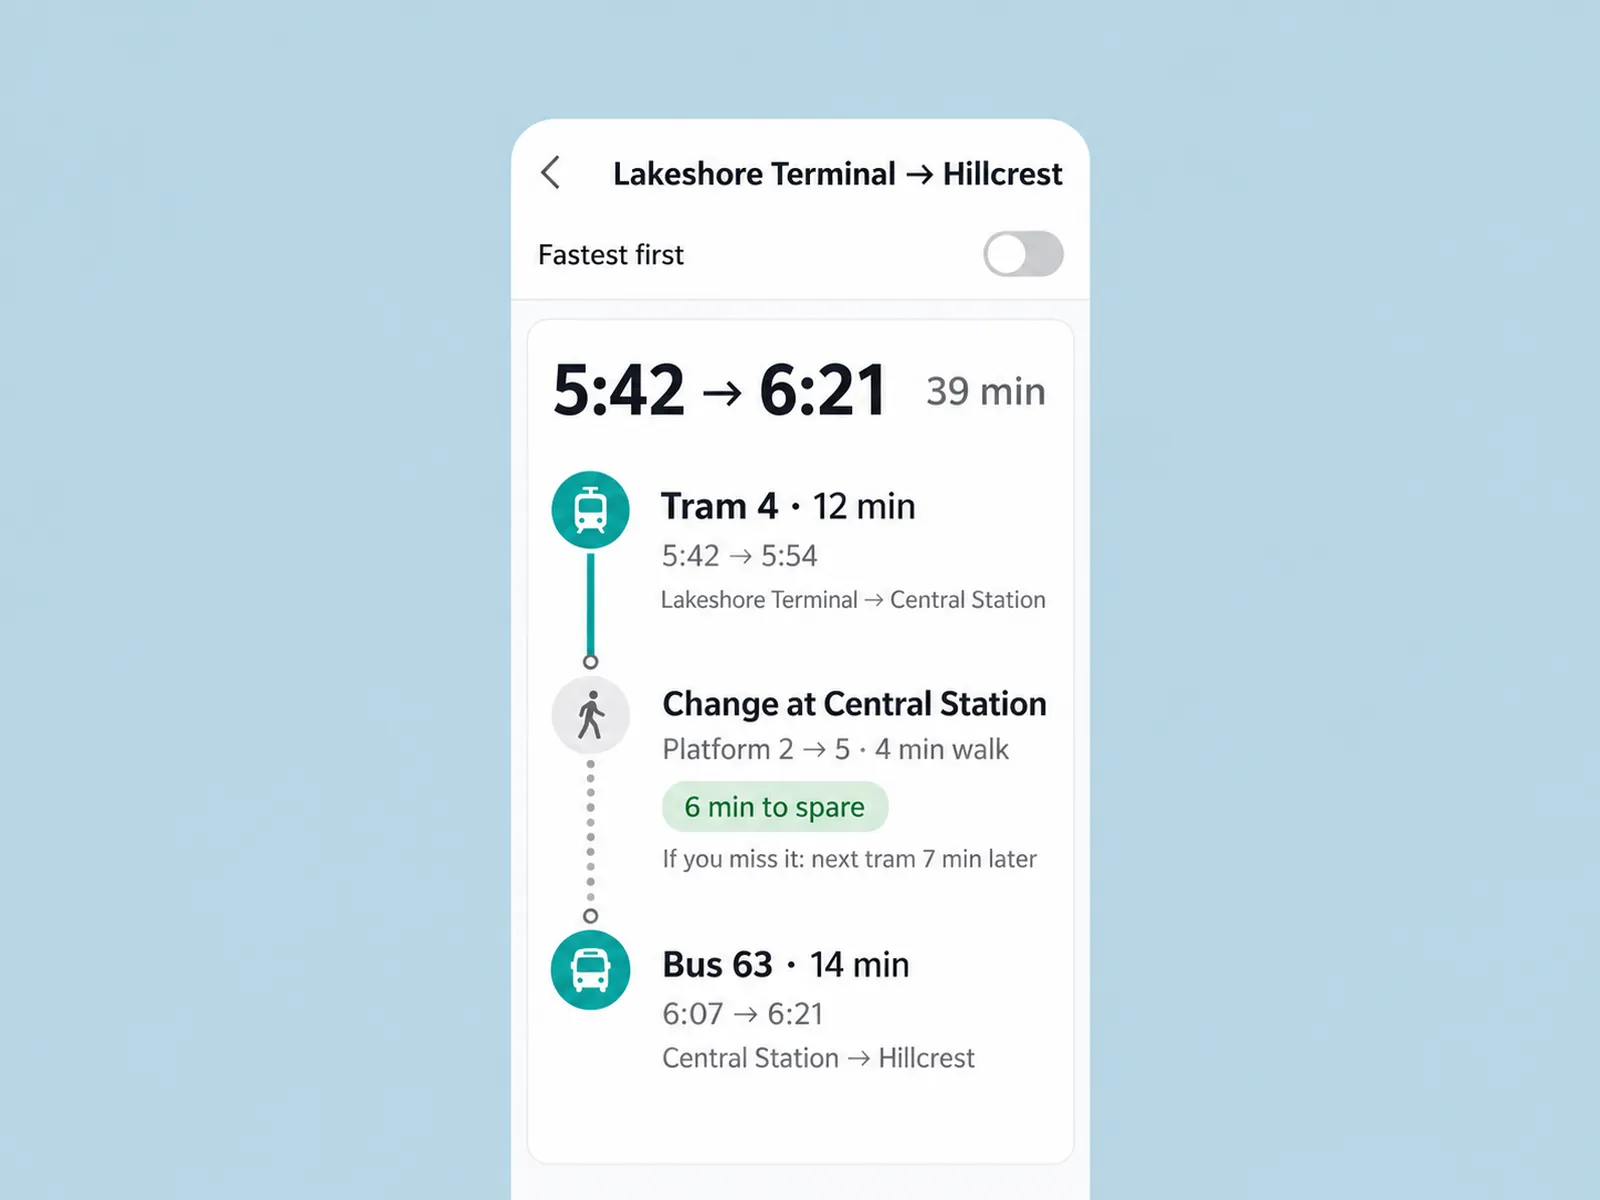
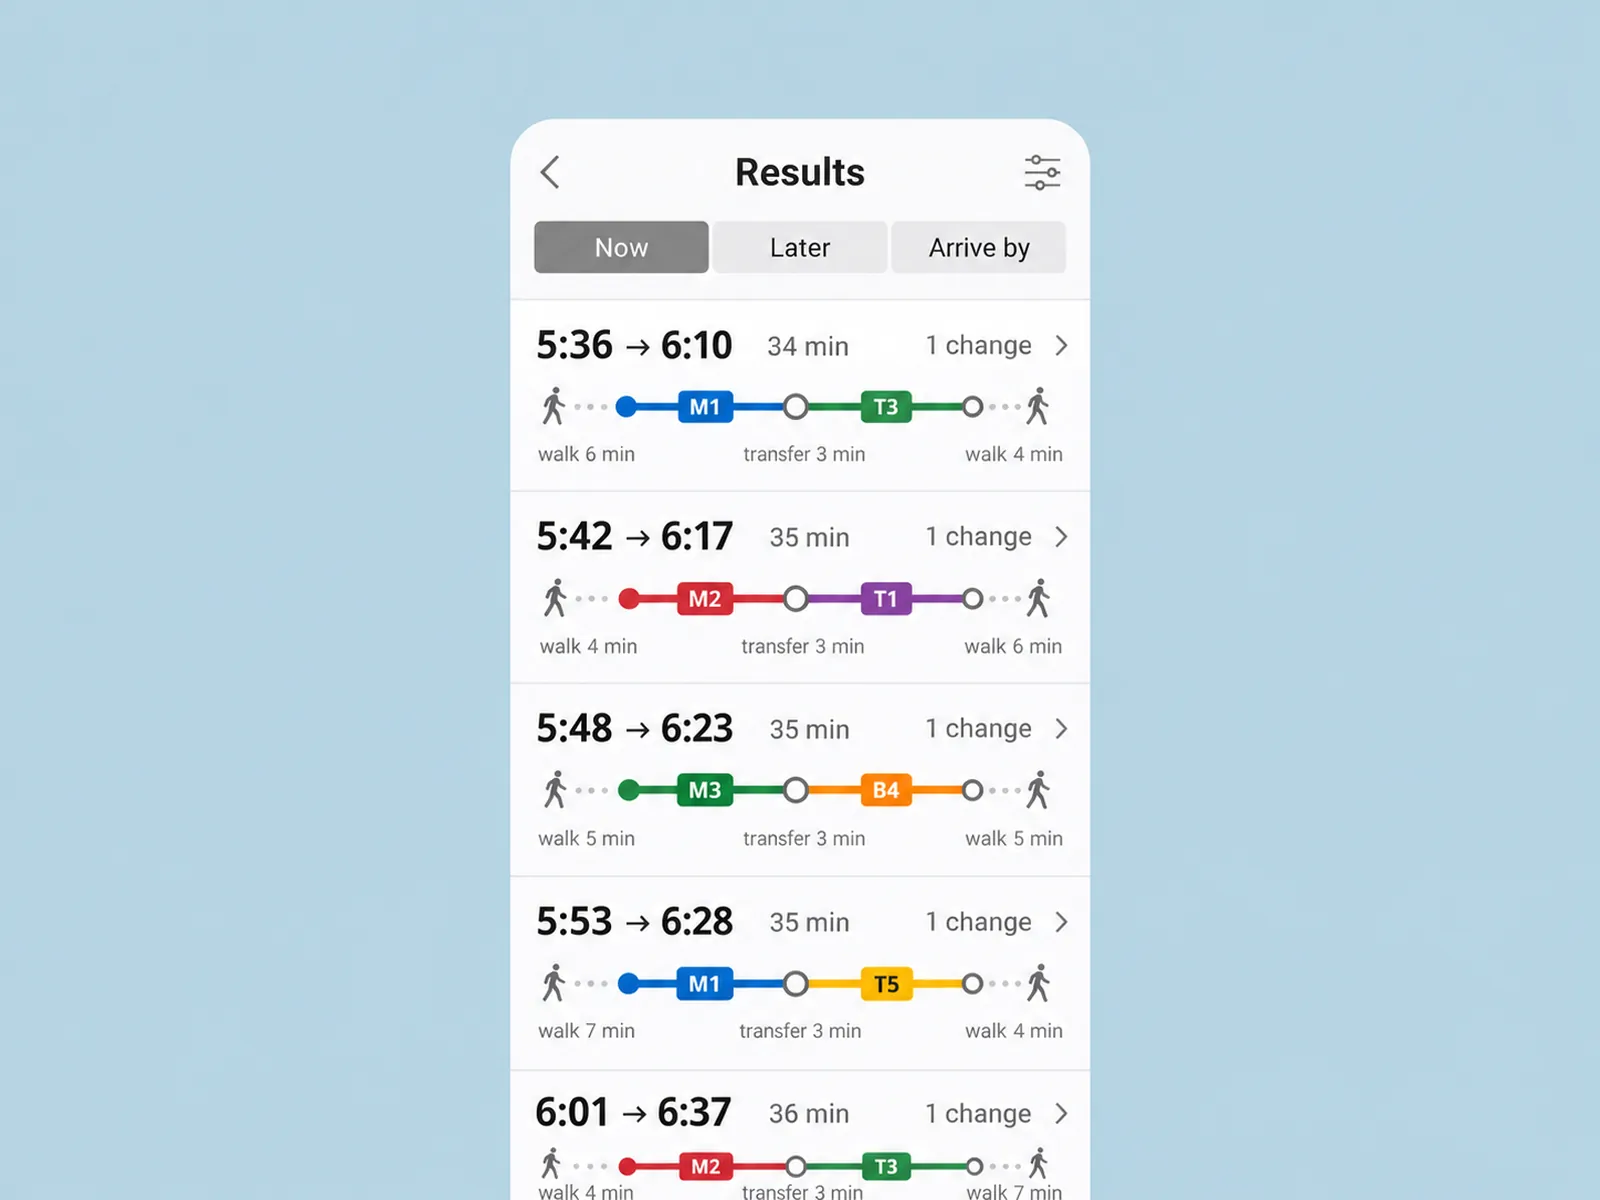
Drag to compare the results screen before and after. The transfer becomes a step of its own. Or focus the slider and use the arrow keys.
Show the cost of missing it
Our first idea was a percentage: “82% chance of making it”. In testing, people read it as a promise and were angry when it failed, or ignored it. A red “risky” label was worse, because it steered riders away from the only practical route.
What worked was a fallback: “6 min to spare. If you miss it, the next tram is 7 minutes later.” Once the downside was a number riders could live with, they chose the tight connections too.
Walk like a person, not a point
Transfer steps use real walking times and name the platform, the exit and a step-free route. We shipped the dataset for twelve hubs and handed the agency a template for the rest. Drawing the map pin was cheap. Keeping the numbers honest is the expensive part, and I would rather say so in the handoff than pretend otherwise.
Outcome
−31%
missed connections, 12 weeks after launch
−24%
support tickets about a missed connection
+1.4
min
median trip length, the price of a safer plan
Missed connections fell 31% in the twelve weeks after the 14 July launch. Support tickets that mention a missed connection fell by a quarter. The price is real, and we chose it: the median trip is 1.4 minutes longer. Only 9% of riders switch the “Fastest” toggle on, which tells us most are happy to pay it. We looked for harm where it could hide. Trips started per rider stayed flat, and the app rating among regular commuters rose from 4.4 to 4.7 over the same period.
Reflection
I would bring the agency’s operations team in during week one, not week fourteen. They kept platform changes in a shared spreadsheet that we only found in June. The planner now says out loud when it is not sure. Riders will never notice that, and it is the part I am proudest of. Next up is letting riders correct a walking time on the spot, which is also how we keep the dataset alive.